Quantitative Workshop

  1. Events
  2. Quantitative Workshop

Views Navigation

Event Views Navigation

Today

Applied General Equilibrium Models for Policy Evaluation

Putrajaya

Computable general equilibrium (CGE) models are increasingly being used for analyzing economy- wide impacts of various policies. These models are useful for analyzing issues where inter-industrial and inter-agent linkages are crucial. CGE models are large numerical models which combine economic theory with real economic data in order to derive computationally the impacts of policies or shocks in the economy. CGE models fit economic data to a set of equations which aim to capture the structure of the economy and behavioural response of agents (firms, households, government). This provides a framework to simulate policy changes and trace the impact on key economic variables, including income and expenditure flows.

Global Value Chain Indicators for Development and Policy

Putrajaya

This module provides an overview of economic-geographical globalization processes within the global value chain (GVC) perspective. It provides discussion on how the increasingly large number of industries that use or provide outsourcing and “offshoring” can create a sustainable competitive advantage for countries who participate in the GVC. Focus is also given on the analysis of trade in value added (TiVA) that includes current development of databases for GVC analysis and core analytical indicators for TiVA. Participants who successfully accomplished the course will have a useful overview and a set of concepts and insights that could be used for charting economic opportunities for strategic planning in the global supply chain networks. A hands-on session will be conducted to get in-touch with the data and interpretations for a well-informed policy making.

Input-Output Technique for Sustainable Development Analysis

Putrajaya

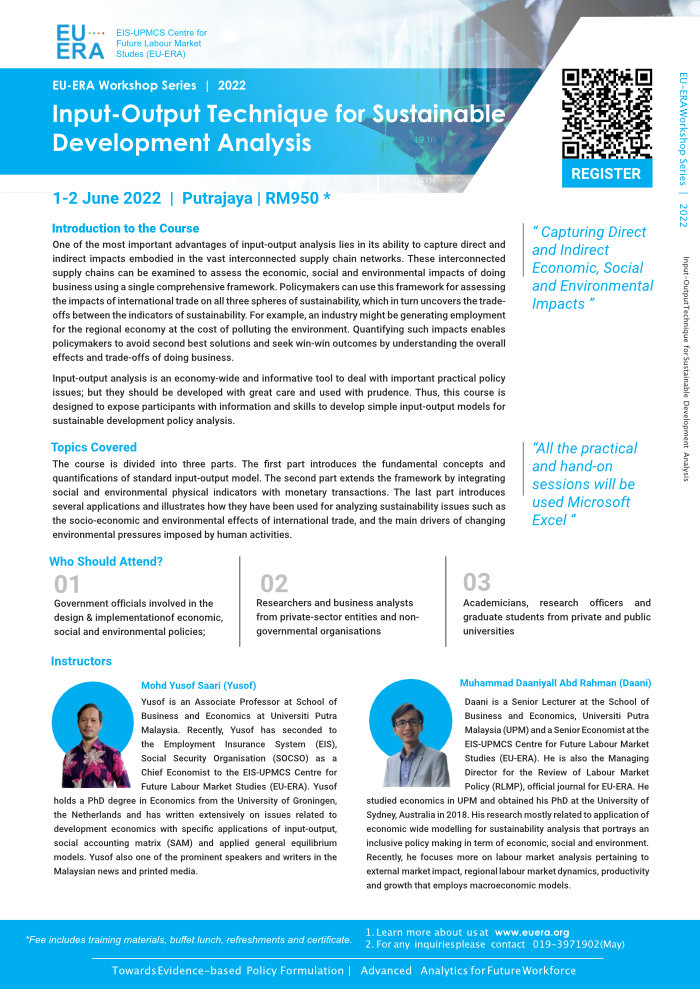
One of the most important advantages of input-output analysis lies in its ability to capture direct and indirect impacts embodied in the vast interconnected supply chain networks. These interconnected supply chains can be examined to assess the economic, social and environmental impacts of doing business using a single comprehensive framework. Policymakers can use this framework for assessing the impacts of international trade on all three spheres of sustainability, which in turn uncovers the trade- offs between the indicators of sustainability. For example, an industry might be generating employment for the regional economy at the cost of polluting the environment. Quantifying such impacts enables policymakers to avoid second best solutions and seek win-win outcomes by understanding the overall effects and trade-offs of doing business.

Input-output analysis is an economy-wide and informative tool to deal with important practical policy issues; but they should be developed with great care and used with prudence. Thus, this course is designed to expose participants with information and skills to develop simple input-output models for sustainable development policy analysis.

Econometric for Practitioners

Putrajaya

The course deals with some understanding of the basic concept in econometrics and its application to economic data. The main thrust of this course will be on modelling of single-equation economic time series. In modern econometrics, all estimations have to deal with non-stationary variables characterize with non-constant mean and variances that resulted in spurious regression problem. In this workshop, we introduce and explore the concept of unit root, cointegration and long-run modelling to avoid such spurious regression issues. The applied work will be performed by using EViews, a program for statistical and econometric analysis, and forecasting distribute by Quantitative Micro Software, LLc, USA. It is intended to help prospective researchers produce better and acceptable research output and ultimately published in some technical reports, working papers, reputable journal, in the region or internationally, by using effective quantitative technique with the help of some econometric software.

EXCEL for Data Analytics

Putrajaya

Excel for Data Analytics introduces participants with little-to-no statistical or software expertise to basic statistical and visualisation tools using the intuitive and popular features in Microsoft Excel, such as Functions, Charts and PivotTables. The course covers data processing to regression modelling with varying degrees of complexity and requires much more advanced skills to manage. This course aims to enhance your expertise in Excel to the highest level and ensure a comprehensive understanding of all the advantageous features Excel can off your workplace

Labour market leading indicator workshop

An accurate, relevant, timely and accesible labour market indicator is essential and critical for policy analysis. This course aims to expose participants with applied econometric model for labour market leading indicators.

This course is structured based on tools and approaches developed by EU-ERA economistsand researchers to determine the key determinants of labour market leading indicators